Purpose
The purpose of this experiment was to determine the amount of ascorbic acid in Minute Maid Original Orange Juice from concentrate using UV-Vis spectrophotometry.
The purpose of this experiment was to determine the amount of ascorbic acid in Minute Maid Original Orange Juice from concentrate using UV-Vis spectrophotometry.
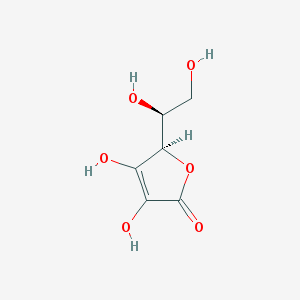
The structure of ascorbic acid (Vitamin C).
Ascorbic acid is also commonly referred to as Vitamin C. This vitamin is one of the water soluble vitamins. According to the Pubchem from the National Open Chemistry Database, ascorbic acid is an essential nutrient needed for maintenance of tissues such as collagen in our skin.
Ascorbic acid has the unique capability of reducing 2,6-dichlorophenolindophenol, which is blue, to a colorless reduced state. This reaction can be visualized below.
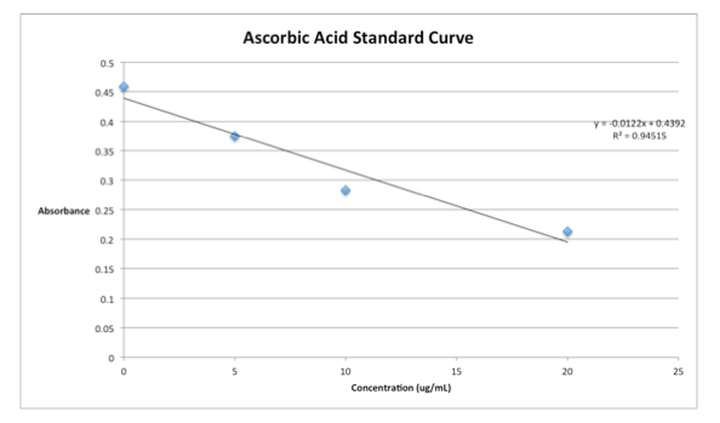
The DCIP molecule absorbs maximally at 520 nm. Hence, we can employ a spectrophotometric assay to assess the loss of color which would be relative to the amount of ascorbic acid in solution. In our data we expect to see a downward sloping standard curve.
The basic set-up and methodology of UV-VIS spectrophotometry is outlined in the image below which was taken from the Nielsen textbook.
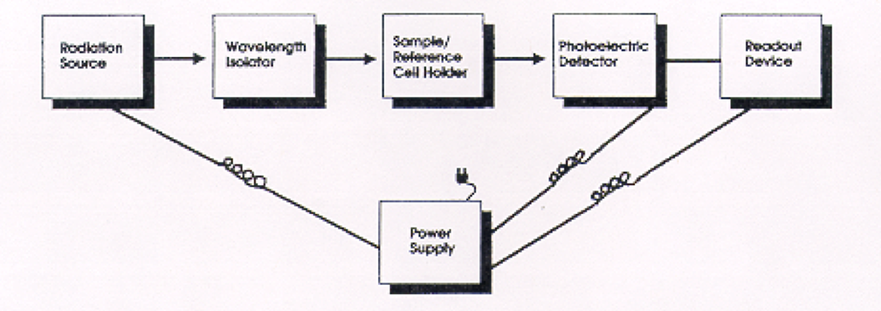
The components of the UV-VIS spectrophotometer.
Procedure
First, standards of ascorbic acid for the standard curve were prepared. Microtubes with known concentrations of ascorbic acid (0, 5, 10, 20 micrograms/mL) were made from a 200 micrograms/mL stock solution of ascorbic acid. A 2 mL sample from each standard was placed in a separate tube along with 3 mL of Sodium Citrate buffer and DCIP. A UV-VIS spectrophotometer was used to take measurements at 520 nm. However, we did these quickly because of the instability of DCIP, which would have otherwise affected our results. We repeated this procedure in order to have duplicate data and then proceeded to plot our standard curve. The ensuing part of the procedure entailed preparing the three solutions of orange juice. Chilled orange juice was prepared into 1:20 and 1:40 dilutions whereas room temperature and warm orange juice were prepared into 1:10 and 1:20 dilutions. We then added the DCIP to the mixtures and took the measurements rapidly before the DCIP broke down.
First, standards of ascorbic acid for the standard curve were prepared. Microtubes with known concentrations of ascorbic acid (0, 5, 10, 20 micrograms/mL) were made from a 200 micrograms/mL stock solution of ascorbic acid. A 2 mL sample from each standard was placed in a separate tube along with 3 mL of Sodium Citrate buffer and DCIP. A UV-VIS spectrophotometer was used to take measurements at 520 nm. However, we did these quickly because of the instability of DCIP, which would have otherwise affected our results. We repeated this procedure in order to have duplicate data and then proceeded to plot our standard curve. The ensuing part of the procedure entailed preparing the three solutions of orange juice. Chilled orange juice was prepared into 1:20 and 1:40 dilutions whereas room temperature and warm orange juice were prepared into 1:10 and 1:20 dilutions. We then added the DCIP to the mixtures and took the measurements rapidly before the DCIP broke down.
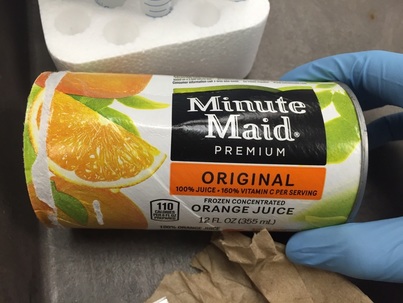
Container of the orange juice sample used.
Results and Conclusion
Below is our standard curve which we generated in this experiment. Notice that it is downward sloping as we predicted.
We then did the appropriate calculations to determine the amount of ascorbic acid in each orange juice sample. The results are found in the table below:
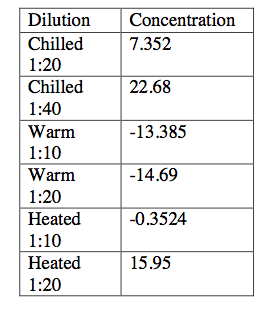
We then used these data to calculate the amount of ascorbic acid in each juice sample. Accordingly, we adjusted for the dilutions in our calculations. There should have theoretically been 90 mg of ascorbic acid in each sample.
Chilled: 35.290 mg ascorbic acid
Warm:-64.25 mg ascorbic acid
Heated: 75.26 mg ascorbic acid
Chilled: 35.290 mg ascorbic acid
Warm:-64.25 mg ascorbic acid
Heated: 75.26 mg ascorbic acid
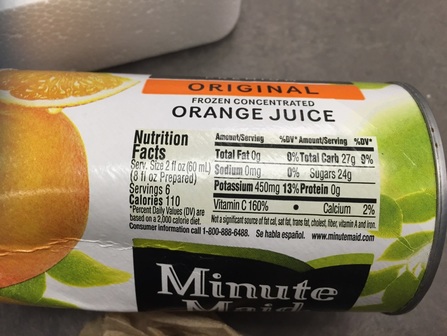
The nutritional label of our sample from which we calculated the theoretical amount of ascorbic acid.
We determined the amount of vitamin C in three different orange juice samples by employing a spectrophotometric assay and assessing the change in the DCIP molecule. We found that the heated orange juice had the most accurate amount of vitamin C since it was closest to the value on the label from the container. As the data indicate, the warm sample did not provide accurate results. When we took the absorbance of this sample we found that the it was outside of the region of our standard curve, hence we got negative values when we used our model to approximate the concentrations. It is likely that the preparation of the warm sample was inconsistent with the preparation of the other two.
