Purpose
The Bicinchoninic Assay (BCA) is a contemporary method for determining protein concentration. It is based off of the Biuret reaction which involves the coordination between the peptide backbone and cuprous ion under alkaline conditions (pH 11.25). The product of this reaction is a cupric ion that is coordinated to peptide nitrogen atoms. The BCA reagent, whose molecular structure is pictured at the top of the page, then reacts with these cupric ions in a 2:1 ratio, yielding a colorful complex whose absorbance is detected with 562 nm of light. Thus, protein concentration is now proportional to absorbance and we employ spectrophotometry and a standard curve to determine the concentration of protein in a solution. The original article that introduced the BCA method that was published in Analytical Biochemistry in 1985 can be found by clicking here.
The Bicinchoninic Assay (BCA) is a contemporary method for determining protein concentration. It is based off of the Biuret reaction which involves the coordination between the peptide backbone and cuprous ion under alkaline conditions (pH 11.25). The product of this reaction is a cupric ion that is coordinated to peptide nitrogen atoms. The BCA reagent, whose molecular structure is pictured at the top of the page, then reacts with these cupric ions in a 2:1 ratio, yielding a colorful complex whose absorbance is detected with 562 nm of light. Thus, protein concentration is now proportional to absorbance and we employ spectrophotometry and a standard curve to determine the concentration of protein in a solution. The original article that introduced the BCA method that was published in Analytical Biochemistry in 1985 can be found by clicking here.
An overview of the reaction scheme in the BCA Assay
The video tutorial below highlights the key principles underlying the BCA assay:
Procedure
We studied a ham sample for this experiment. We first blended and homogenized the ham sample in a blender with extraction buffer in order to lyse cells and isolate as much protein in solution as possible. 30 mL of this homogenate was spun using a centrifuge (2000 rpm x 15 min) in order to segregate solid components of the sample from the supernatant. The supernatant, which contained soluble proteins, was extracted and filtered using Whatman filter paper. The corresponding reagents for the BCA reaction were pre-mixed. Next, we prepared dilutions of our sample for spectrophotometric analysis (1:5, 1:10, 1:20) with the Pierce Reagents. Bovine Serum Albumin was the protein standard used to generate the standard curve. All solutions were incubated at 37o C for 30 minutes. Absorbance readings were subsequently taken following the incubation period. We also collected data for bologna samples provided by another group.
Results and Conclusions
The standard curve can be viewed below. The calculations for protein concentrations were determined using this standard curve model, which afforded a strong correlation coefficient of 0.974.
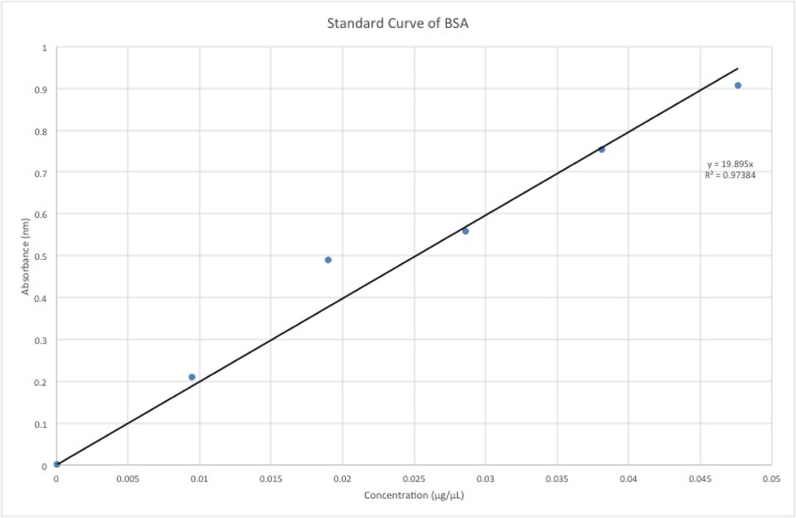
The standard curve generated for the BCA assay. Bovine Serum Albumin was used as the protein standard.
Our absorbance data and the fitted model afforded by the standard curve allowed us to carry out calculations for the protein concentrations of the ham and bologna samples. We found that there was 14.652 grams of protein in the 90 g sample of ham that we used. The USDA Nutrient database reported that there should have been 14.94 g of protein in a standard 90 g sample of deli ham. Thus, there was only a mere 1.92% error. Similarly, we were able to determine the amount of protein in the bologna samples, which came out to be 16.11 grams of protein. The theoretical amount should have been 13.68 grams and the percent error for this meat came out to be 17.76%, which was much higher than for the hame. The BCA assay is optimized for tuna protein. Hence, we speculated that the assay might have inherently been a better predictor of protein in ham than in bologna. Moreover, bologna has a variety of meats and proteins in its composition. Thus, there may be a lot of variation in different bologna samples.
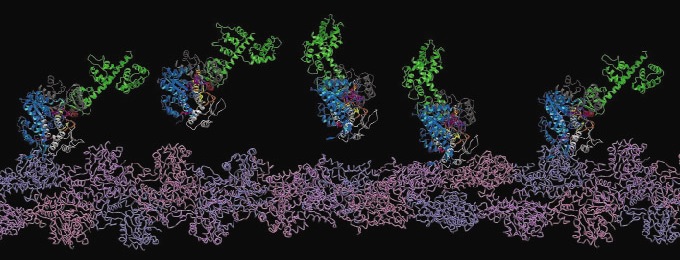
Crystal structures of actin and myosin proteins that are prominent in ham, which is essentially muscle tissue.
